Spending hours on basic data tracking, visualization, and reporting can consume a significant chunk of your team’s time. This is where the magic of marketing reporting software comes in, offering a way to automate these tasks, thereby saving your organization significant time and resources.
Understanding the performance of your marketing efforts is crucial for driving growth and enhancing your ROI, and the simplest way to start is by employing digital marketing reporting tools. With numerous types available, we’ve curated a list of recommended options to streamline your reporting process.
What Is a Digital Marketing Reporting Tool?
A digital marketing reporting tool is a specialized software designed to gather, measure, and visualize key performance indicators from digital marketing campaigns across various platforms. These tools serve as a centralized hub for marketers to analyze data from diverse sources like social media, email campaigns, paid ads, and website traffic.
The main function of these tools is to present complex data in an accessible way, enabling marketers to understand which strategies are successful, where improvements are needed, and how to allocate resources effectively to maximize ROI.
Essentially, they provide a clear overview of marketing efforts and their outcomes, helping to optimize strategies and justify marketing investments.
Types of Digital Marketing Reporting Tools
Digital marketing reporting tools can vary widely in functionality and purpose, catering to different aspects of marketing campaigns. Here are some common types of these tools:
Web Analytics Tools: These tools track and analyze the behavior of visitors on a website. They provide data on metrics like page views, unique visits, time spent on site, and bounce rates.
Social Media Monitoring Tools: These tools help marketers track social media conversations and measure the impact of social media campaigns. They offer features like tracking mentions, engagement rates, and sentiment analysis.
SEO Reporting Tools: SEO tools focus on providing insights related to search engine performance, including keyword rankings, backlink analysis, and competitor comparisons.
Email Marketing Analytics Tools: These tools are used to analyze the performance of email marketing campaigns, tracking metrics such as open rates, click-through rates, and conversions.
Paid Ad Reporting Tools: Focused on the performance of paid advertising campaigns, these tools track the effectiveness of ads across various platforms like Google Ads and Facebook Ads. They provide insights on cost-per-click (CPC), conversion rates, and ROI.
Multi-Channel Reporting Tools: These tools consolidate data from various marketing channels to provide a holistic view of digital marketing efforts. They help marketers understand how different channels interact and contribute to overall goals.
Content Performance Tools: These tools help measure the success of content marketing efforts, tracking engagement metrics such as shares, likes, and comments on published content.
How to Choose a Marketing Reporting Tool
Choosing the right marketing reporting tool for your team involves a nuanced approach, as no single tool can meet every need perfectly.
Automation
Essential for any modern marketing team, reporting tool automation significantly boosts productivity by streamlining repetitive tasks.
Look for tools that can automate data collection report generation, and even alert you to significant changes in your key performance indicators (KPIs). This not only saves time but also ensures that your team can focus on strategic tasks rather than manual data handling.
Customization
Every marketing team has unique needs based on their specific goals and the channels they utilize. A good reporting tool must offer deep customization options—not just in terms of which metrics you can track, but also in how you can manipulate and display this data.
Whether it’s tailoring dashboards to highlight certain data points or configuring reports to focus on specific marketing channels like social media or PPC, customization is key. For instance, if your team relies heavily on a CRM or uses specific e-commerce platforms, finding a reporting tool that integrates with these systems will provide more cohesive insights.
Scalability
Your chosen tool should be able to grow with your business. This means it should handle increased volumes of data and more complex setups as your marketing efforts expand. Scalability also pertains to user access control, ensuring that as your team grows, new members can easily be added and managed within the tool.
Visualization
Effective data visualization is crucial as it transforms complex data sets into understandable and actionable insights. Look for tools that not only offer comprehensive visualization options like graphs, heat maps, and custom dashboards but also support real-time data updates. This feature is particularly valuable during fast-paced campaigns or events where live data can inform immediate strategic decisions.
Support and Updates
A good reporting tool will have strong customer support and regular updates to keep up with the latest marketing trends and technologies. This includes having a responsive customer service team and offering regular training or resources to help your team make the most of the tool.
9 Best Marketing Reporting Tools
- Google Analytics
- AgencyAnalytics
- DashThis
- Whatagraph
- Databox
- Klipfolio
- DataHero
- Looker Studio (formerly Google Data Studio)
- Ruler Analytics
Google Analytics

Google Analytics is widely acknowledged as the cornerstone tool for web and marketing analytics, used by approximately 90% of marketers to gauge online performance. This tool excels in offering insights into customer behavior, user experience, and interaction with online content, across different devices.
While Google Analytics provides a robust foundation for understanding basic website and user metrics, integrating advanced tools like Ruler can significantly enhance its capabilities. Ruler integration allows marketers to trace the quality and revenue impact of different marketing sources, providing a deeper layer of insight into which strategies are truly effective.
Google Analytics Features
- Custom Reports: Tailor reports to fit your specific needs by combining any of the metrics and dimensions you regularly track in a format that suits your business best.
- Event Tracking: Monitor and analyze site interactions that don’t involve a page load, such as downloads, video views, and mobile ad clicks, which are crucial for understanding user engagement.
- Multi-Channel Funnels: See the full path customers take over multiple interactions—so you can understand how your marketing channels work together to create sales and conversions.
- E-commerce Tracking: Gain insights into user purchases on your site, including transaction data, product performance, and sales conversion rates, enabling a deeper understanding of your e-commerce effectiveness.
- Site Speed Analysis: Understand how quickly your site loads for visitors, identify where it lags, and find out how various elements (like images or scripts) affect the loading time.
- Mobile Performance Measurement: Evaluate the performance of your website on mobile devices, providing insights into mobile traffic, user behavior, and conversion metrics.
- Content Experiments: Test different versions of your web pages to see how changes in content affect user behavior, which is integral to optimizing user experiences and improving site performance.
Google Analytics Pricing
- Google Analytics Standard Version: This version of Google Analytics is free of charge and extremely user-friendly, making it an excellent choice for small businesses and startups just beginning to explore the realm of web analytics. It offers essential features that allow these organizations to track and analyze website traffic, understand visitor behavior, and gauge the effectiveness of their content and marketing strategies.
- Google Analytics 360: Tailored for larger enterprises with more sophisticated needs, Google Analytics 360 is a premium service that provides advanced features and enhanced integration capabilities.
This version operates on a tiered pricing structure, which can vary significantly based on the scale and specific requirements of the business, with costs potentially reaching up to £150,000 annually.
AgencyAnalytics
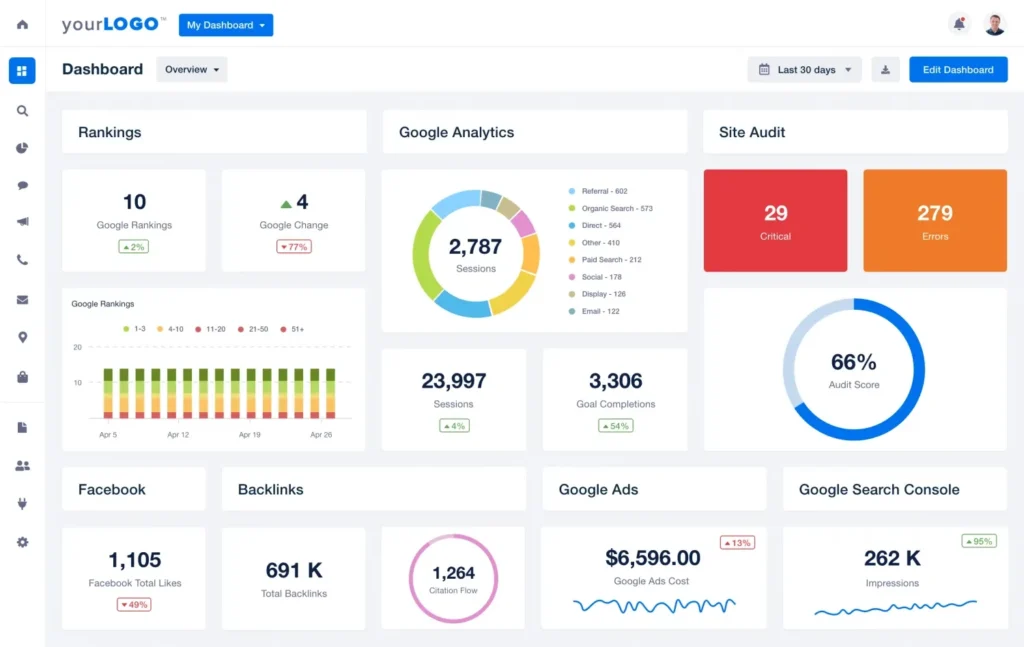
AgencyAnalytics is a comprehensive marketing reporting tool designed with agencies in mind. It simplifies reporting by integrating with over 70 marketing platforms, allowing agencies to manage all their data from a single dashboard. This integration capability covers a wide range of digital marketing aspects, including PPC, SEO, social media, email marketing, and call tracking.
The platform is highly customizable, featuring white-label capabilities that let agencies brand their dashboards and reports as their own, enhancing client presentations.
AgencyAnalytics Features
- Automated Reporting: The platform allows users to automate their reporting processes, enabling scheduled reports to be sent directly to clients. This feature ensures that reports are delivered consistently and on time, reducing manual work and increasing efficiency.
- SEO Audit Tool: An integrated SEO audit tool helps agencies to quickly assess the SEO health of their clients’ websites. This tool checks for common SEO issues and provides recommendations for improvements, which can be crucial for optimizing clients’ search engine rankings.
- Social Media Analytics: AgencyAnalytics provides in-depth analytics for various social media platforms. This allows agencies to track all social media interactions, such as likes, shares, comments, and more, giving a comprehensive view of social engagement and campaign performance.
- Client Portals: The platform offers personalized client portals where clients can log in and view their reports and dashboards. These portals are customizable, enabling agencies to deliver a branded experience that can impress clients and reinforce agency branding.
- API Access: For tech-savvy agencies that require more customization, AgencyAnalytics offers API access. This allows agencies to create custom integrations and functionalities, tailor-made to their specific needs and the needs of their clients.
- Mobile App: A mobile app is available for both iOS and Android devices, providing users with the flexibility to monitor and access client data on the go. This feature ensures that agency staff and clients can stay updated with campaign performance from anywhere.
AgencyAnalytics Pricing
AgencyAnalytics is structured with three distinct pricing levels to accommodate various needs and budgets.
Freelancer Plan: Priced at $10 per month, this plan is ideal for individual marketers who need efficient, streamlined reporting tools without the complexity of larger-scale solutions.
Agency Plan: At $15 per month, this plan is designed for growing marketing agencies that require more robust reporting capabilities and additional user seats.
Enterprise Plan: Offering customizable pricing, this plan is tailored for larger organizations that require a bespoke solution to meet their specific reporting and integration needs.
AgencyAnalytics provides a 14-day risk-free trial, which does not require a credit card to start. This allows you to fully explore the features and capabilities of the platform without any initial financial commitment.
DashThis
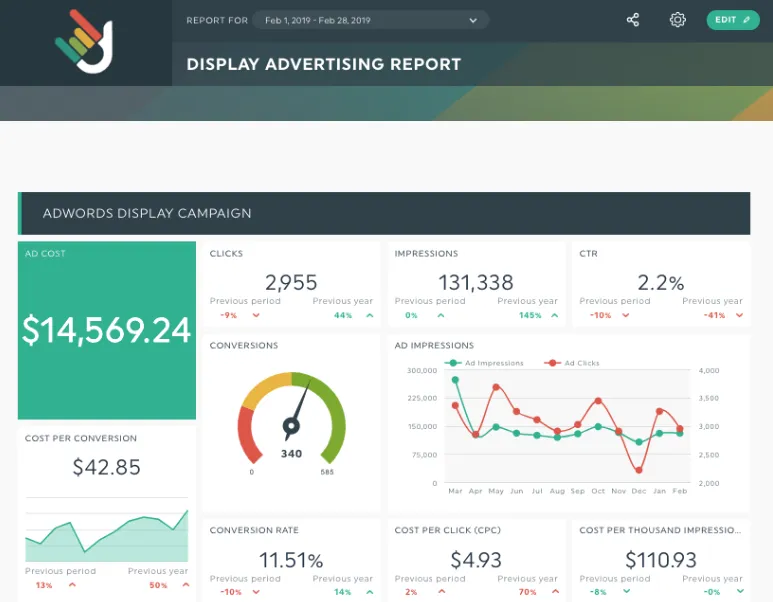
DashThis stands out as a versatile marketing reporting tool that streamlines the reporting process for digital agencies managing multiple campaigns.
With its emphasis on automation and user-friendly design, DashThis enables agencies to consolidate all their data sources into a single, dynamic report. This makes it easier to visualize data and draw actionable insights without the hassle of manual report generation.
DashThis Features
- Automated Data Integration: DashThis simplifies the process of gathering data by automatically pulling information from over 34 different digital marketing tools and platforms, including social media, SEO, PPC, and email marketing tools.
- Customizable Dashboards: Users can create customized dashboards tailored to specific needs or client requirements. The drag-and-drop interface makes it easy to arrange and display data exactly how you want it.
- Pre-built Templates: To save time, DashThis offers a variety of pre-built templates that can be used as a starting point for reports. These templates can be customized further to match the specific analytics needs of different campaigns.
- White Label Options: DashThis allows for white labeling, which means agencies can brand their reports and dashboards with their logos, color schemes, and domain names, offering a seamless brand experience to their clients.
- Scheduled Reporting: Users can set up automated email dispatches to regularly send updated reports to clients or internal teams, ensuring stakeholders stay informed with the latest data.
- Performance Tracking: DashThis provides tools to track and measure the performance of various marketing campaigns across different channels, helping users understand what is working and what isn’t.
- Collaborative Features: The platform supports collaboration among team members, making it easier to share insights, work on reports together, and make data-driven decisions collectively.
DashThis Pricing
Starter Plan: Begins at $45 per month, offering limited features suitable for smaller teams or those just starting with automated reporting.
Premium Plans: For medium to large-sized agencies requiring more robust capabilities, such as White Label features and multiple dashboard variations, premium plans start at $139 per month. These plans are designed to accommodate the needs of agencies managing extensive client portfolios.
Test out DashThis with a 15-day free trial, allowing you to explore its features and usability before committing to a paid plan.
Whatagraph
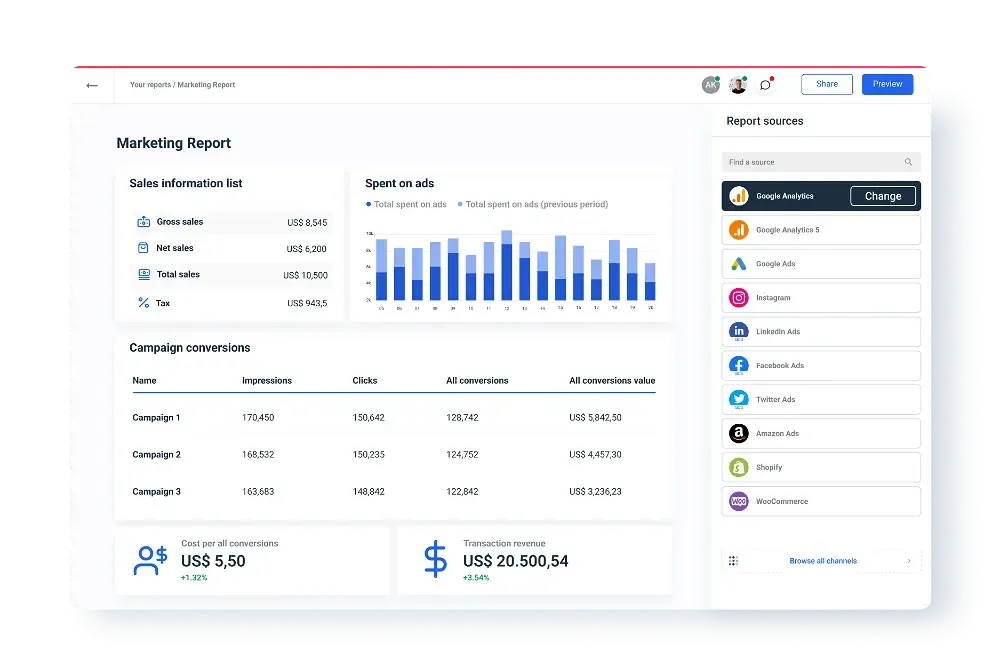
Whatagraph stands out as a dynamic marketing reporting tool designed specifically to streamline the reporting process for both agencies and in-house marketing teams. This tool simplifies the creation of detailed marketing reports by allowing users to automatically import data from over 40 different sources directly into their reports.
Whatagraph Features
- Multi-Source Data Integration: Whatagraph allows users to integrate with over 40 different marketing tools and platforms. This includes popular social media, PPC, SEO, and email marketing platforms, enabling users to pull data directly into their reports without the need for manual input.
- Automated Reporting: Save time with the ability to automate the entire reporting process. Whatagraph can generate reports automatically at scheduled intervals, sending updated data and insights directly to stakeholders.
- Visual Report Builder: The platform features a drag-and-drop report builder that makes it easy to create visually appealing and informative reports. Users can customize the layout and design of their reports to match their brand or the specific preferences of their clients.
- Pre-built and Custom Templates: Whatagraph provides a variety of pre-built templates that can be used as a starting point for reports. Users have the option to create fully custom reports, tailoring every aspect to meet specific needs.
- Collaborative Tools: Teams can collaborate on report creation and editing, which ensures consistency and accuracy across reports prepared by different team members. This feature is particularly useful for agencies and large marketing departments.
- Real-Time Data Processing: Reports update in real-time as new data comes in, providing the most current insights possible. This is crucial for making timely decisions based on the latest marketing performance data.
- White Label Solutions: Agencies can utilize Whatagraph’s white labeling options to present reports under their own brand, enhancing professional presentation and maintaining brand consistency across client communications.
Whatagraph Pricing
Professional Plan: Starting at $199 per month. This plan is designed for small to medium-sized marketing teams needing robust analytics and reporting capabilities.
Access to a comprehensive set of data integration options, allowing for efficient report generation and analytics across multiple platforms.
Premium Plan: Starting at $299 per month. Geared towards larger marketing teams or agencies requiring advanced reporting features and greater customization.
Enhanced support, more extensive data integrations, and additional customization options for reports and dashboards.
Custom Plan: Custom pricing based on specific needs. Tailored specifically for organizations with unique or highly specific reporting needs that go beyond the standard offerings.
Fully customizable features and integrations, dedicated support, and scalability to meet enterprise-level requirements.
Databox
Databox is a versatile data visualization and analytics tool that simplifies the tracking of key performance indicators across different facets of a business. It integrates various data sources into a single dashboard, enabling users to monitor and analyze marketing, sales, and overall business performance comprehensively.
Databox Features
- Real-Time Data Sync: Automatically syncs data from multiple sources in real-time, ensuring that all information displayed is current and accurate.
- Customizable Dashboards: Users can create custom dashboards tailored to specific business needs, choosing from a wide array of visualization options to best display their data.
- Goal Tracking: Allows users to set and monitor progress towards specific performance goals, making it easier to measure success and make adjustments when necessary.
- Alerts and Insights: Offers automated alerts and insights based on the data trends observed, helping users stay informed of significant changes or achievements.
- Mobile Accessibility: Provides a mobile app that enables users to access their dashboards and receive updates on the go, ensuring they are always connected to their data.
- Predictive Analytics: Utilizes advanced algorithms to predict future trends based on historical data, aiding in strategic planning and decision-making.
- Extensive Integrations: Supports over 60 integrations with various platforms, including CRM systems, marketing automation tools, and financial software, allowing for a comprehensive view of business operations.
Databox Pricing
Free-Forever Plan: Free, perfect for testing the tool’s basic capabilities and determining if it meets initial needs.
Professional Plan: Starts at $169 per month. Includes White Label branding and access to premium features suitable for more extensive agency needs.
Klipfolio
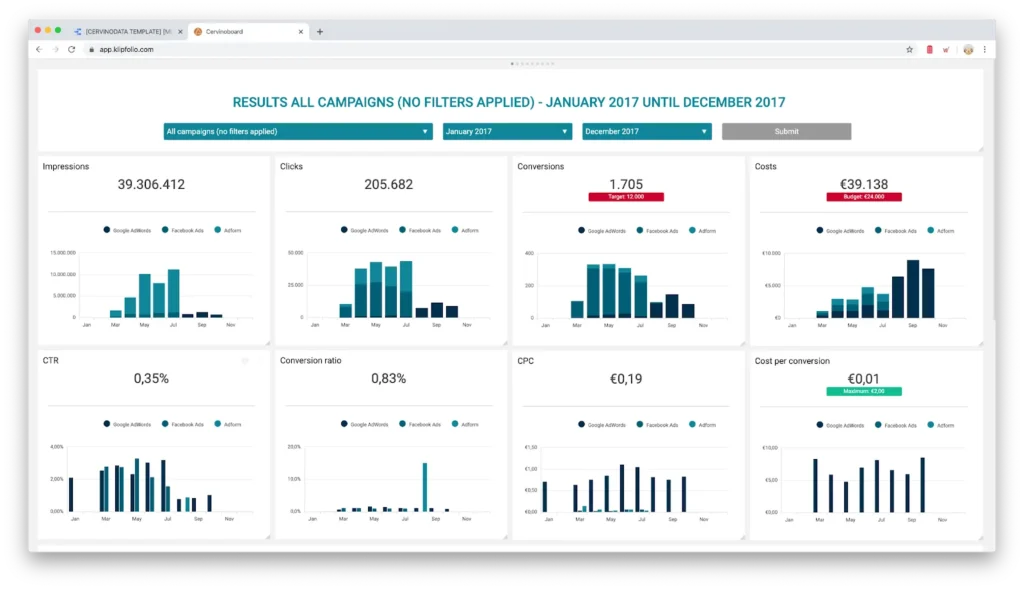
Once connected to various marketing channels, users can quickly set up and launch their dashboards using Klipfolio’s pre-made templates, which are designed to get users started without delay. For those needing more tailored solutions, Klipfolio provides a powerful visual editor that allows for extensive customization.
Klipfolio Features
- Dual Services: Klipfolio offers two distinct services, PowerMetrics and Klips, tailored to different types of users. PowerMetrics is designed for in-house teams focusing on concise metrics, while Klips is suited for agencies managing data across multiple clients.
- Pre-Made Dashboard Templates: To help users get started quickly, Klipfolio provides a variety of pre-made dashboard templates. These templates can be instantly applied once marketing channels are connected, providing a fast and effective setup.
- Visual Editor for Customization: For more specific needs, Klipfolio features a visual editor that allows for in-depth customization of dashboards. Users can modify existing templates or build entirely new ones from scratch, offering complete control over the presentation of data.
- Real-Time Data Integration: Klipfolio supports real-time data integration from a wide range of sources, ensuring that all dashboards and reports reflect the most current data available.
- Collaboration Tools: With team sharing capabilities, Klipfolio facilitates collaboration among team members, allowing for shared access to dashboards and enabling teams to work together efficiently.
- Automated Reporting: Users can set up automated reporting schedules, ensuring that stakeholders receive timely updates and reports at regular intervals without manual intervention.
- Mobile Accessibility: Klipfolio provides a mobile app that allows users to access their dashboards and reports on the go, ensuring they can stay informed no matter where they are.
Klipfolio Pricing
Free Plan: Allows tracking of metrics from 2 marketing channels. Data can be compared only to the last 2 months, available in dashboard view only, providing a limited but useful glimpse into channel performance for smaller needs.
Plus Plan: Priced at $142 per month, this plan includes tracking for up to 10 marketing channels and extends data comparison to up to 1 year. It also allows users to save reports in PDF format, enhancing report sharing and presentation.
Pro Plan: At $349 per month, this plan is designed for businesses needing even more extensive data integration, supporting an increased number of data channels for comprehensive analytics and reporting.
DataHero
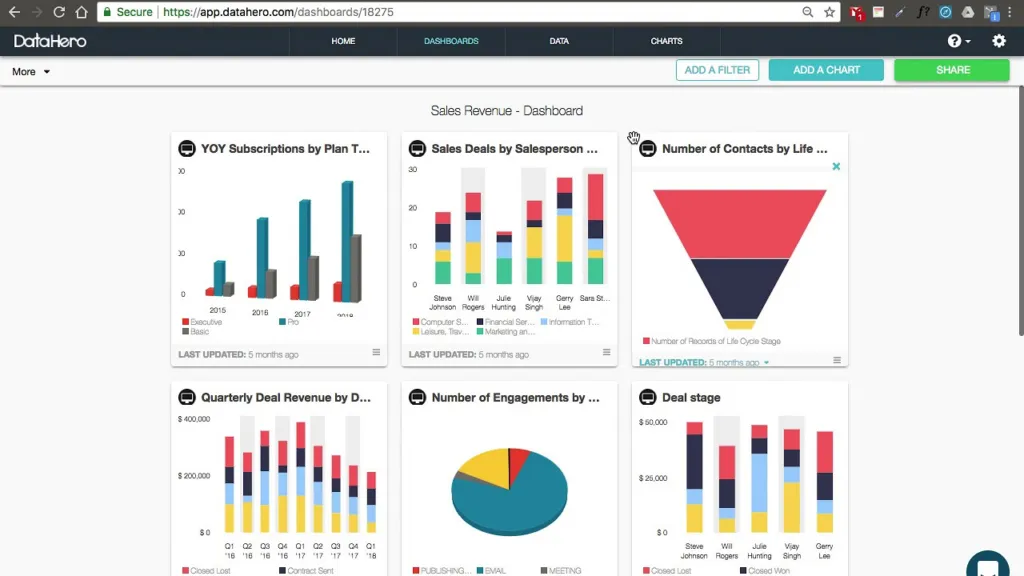
DataHero is a versatile reporting tool that extends beyond traditional marketing-focused analytics to integrate with a variety of cloud services, including ZenDesk, GitHub, and Eventbrite. This capability allows you to tailor your reporting specifically to the diverse campaign needs and activities of your clients, making it a highly customizable tool for data analysis.
The tool provides robust options for manipulating and augmenting the data directly within the charts. This feature is particularly beneficial for creating detailed, insightful visualizations tailored to the specific requirements of client reviews, helping them understand complex data through clear, impactful charts.
DataHero Features
- Cloud Service Integration: DataHero supports integration with a wide array of cloud services, not just those traditionally used for marketing. This includes customer service platforms like ZenDesk, development platforms like GitHub, and event management platforms like Eventbrite, allowing users to pull diverse data for comprehensive analysis.
- Data Import and Upload: Users can easily upload their data or import it directly from integrated services. DataHero supports various data formats, making it versatile for different types of data handling.
- Intelligent Chart Suggestions: Once data is imported, DataHero analyzes it and suggests the most effective chart types to visualize this data. This feature helps users quickly create visual representations that are both informative and easy to understand.
- Customizable Data Manipulation: DataHero allows for extensive customization within its charts. Users can manipulate data directly in the visualization, adding or adjusting elements to better fit their specific reporting needs.
- Drag-and-Drop Interface: The platform features a user-friendly drag-and-drop interface, which simplifies the process of creating and customizing data visualizations without the need for advanced technical skills.
- Collaborative Features: DataHero provides tools that facilitate collaboration among team members, allowing for shared access to projects and easy distribution of reports among stakeholders.
- Export Options: Finished reports and charts can be exported in various formats, including PDF and CSV, making it easy to share insights with clients or integrate them into other documents.
DataHero Pricing
Starter Plan: Priced at $59 per month. This plan is hosted on the cloud and is suitable for individuals or small teams just starting with data visualization and reporting.
Premium Plan: Available at $99 per month. This cloud-hosted option offers more advanced features, making it ideal for businesses that need more robust data integration and customization capabilities.
Team Plan: While the exact pricing isn’t specified in the provided details, this plan is designed for larger teams requiring collaborative features and higher data handling capacities.
Looker Studio (Google Data Studio)
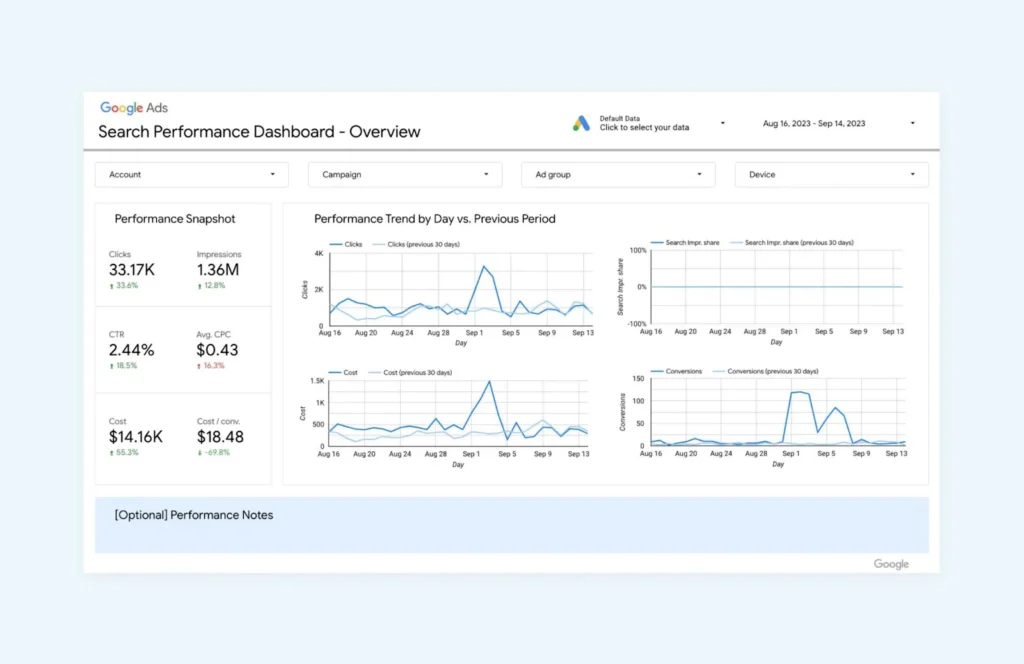
Looker Studio, which was previously known as Google Data Studio, is a powerful business intelligence platform developed by Google. This tool is particularly beneficial for marketing professionals as it allows them to collect, aggregate, and analyze data from over 800 different platforms and applications.
The platform’s ability to share these insights with team members enhances collaborative efforts, making it easier for teams to make data-driven decisions together.
Looker Studio Features
- Data Integration: Looker Studio allows users to connect to over 800 data sources, including Google-based platforms like Google Ads, Analytics, and Sheets, as well as third-party sources such as SQL databases. This extensive connectivity enables seamless data aggregation from multiple streams.
- Customizable Dashboards: Users can create tailored dashboards that meet their specific analytical needs. The platform offers a wide range of visualization options, including charts, graphs, and tables, which can be fully customized in terms of layout and design.
- Real-Time Data Processing: Looker Studio updates data in real-time, providing the most current insights for decision-making. This feature is crucial for tracking fast-changing metrics and trends.
- Collaborative Features: The platform supports real-time collaboration, allowing team members to edit, view, and manage dashboards simultaneously. This fosters a collaborative environment for data analysis and report building.
- Interactive Reports: Reports created in Looker Studio are interactive, meaning users can drill down into metrics for deeper analysis. This interactivity enhances the understanding of data through dynamic exploration.
- Access Control: Looker Studio offers robust access controls, allowing administrators to set user permissions on data access and editing rights. This ensures data security and that only authorized personnel can make changes to reports.
- Embedding Capabilities: Reports and visualizations created in Looker Studio can be easily embedded into websites, presentations, or shared via URLs, making it straightforward to distribute insights across different platforms.
- Templates and Sample Reports: The platform provides a variety of pre-built templates and sample reports to help users get started quickly and inspire new ways of visualizing data.
Looker Studio Pricing
Looker (Google Cloud core) offer three platform editions:
Standard: A Looker (Google Cloud core) product for small organizations or teams with fewer than 50 users that includes one production instance, 10 Standard Users, 2 Developer Users, upgrades, up to 1,000 query-based API calls per month, and up to 1,000 administrative API calls per month.

Enterprise: A Looker (Google Cloud core) product with enhanced security features for a wide variety of internal BI and analytics use cases that includes one production instance, 10 Standard Users, 2 Developer Users, upgrades, up to 100,000 query-based API calls per month, and up to 10,000 administrative API calls per month.

Embed: A Looker (Google Cloud core) product for deploying and maintaining external analytics and custom applications at scale that includes one production instance, 10 Standard Users, 2 Developer Users, upgrades, up to 500,000 query-based API calls per month, and up to 100,000 administrative API calls per month.

Ruler Analytics
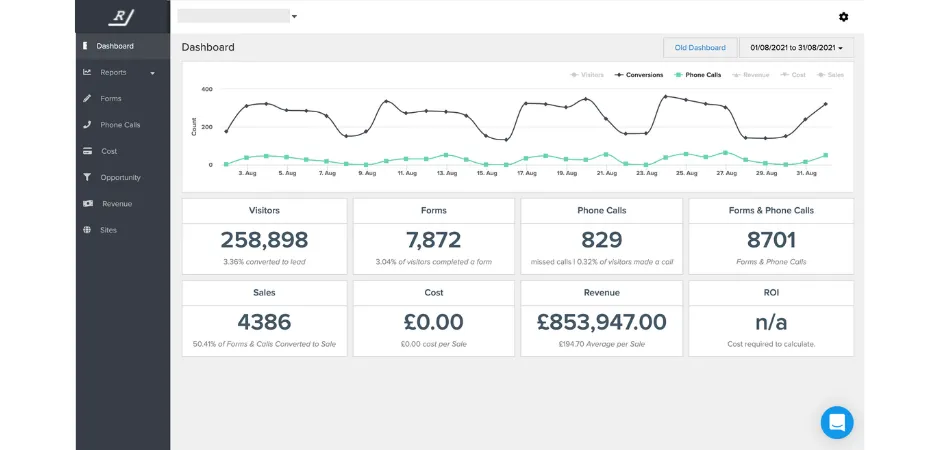
Ruler Analytics is a sophisticated marketing measurement tool that blends the methodologies of multi-touch attribution and marketing mix modeling to provide a comprehensive view of marketing effectiveness. The platform excels in tracking every visitor across multiple sessions, traffic sources, keywords, and other critical data points.
Ruler Analytics Features
- Multi-Touch Attribution: Ruler Analytics tracks the full journey of each visitor across multiple touchpoints, allowing marketers to understand which marketing activities are truly influencing conversions. This feature helps in attributing value to each marketing touchpoint accurately.
- Marketing Mix Modeling: This feature allows marketers to analyze and optimize their marketing strategies by looking at the effectiveness of various marketing channels together, rather than in isolation. It helps in understanding the holistic impact of marketing efforts.
- Visitor-Level Tracking: Ruler Analytics captures detailed data about each visitor, including their interactions over multiple sessions, the keywords they used, and the traffic sources they came from. This granular data is crucial for deep visitor insight and targeted strategy adjustments.
- Call Tracking: This feature integrates phone call data into the attribution model, allowing marketers to track which marketing efforts are driving calls. It’s especially valuable for businesses where phone calls are a significant part of the customer journey.
- CRM Integration: Ruler Analytics can integrate seamlessly with customer relationship management (CRM) systems. This integration allows for the transfer of marketing data into the CRM, enabling a unified view of marketing and sales data.
- Real-Time Reporting: Marketers can access real-time data and reports, allowing for timely decisions based on the most current data available.
- Customizable Dashboards: Users can create custom dashboards that focus on the metrics most relevant to their business goals. This flexibility ensures that marketers can quickly access the data they need.
Ruler Analytics Pricing
Pricing for Ruler starts at £199 a month, with plans based on features and the number of website visitors. You can save 20% by paying annually and there are special rates for agency partners.
Small Business Plan: Designed for businesses with up to 5,000 monthly visits. Pricing starts from £179 per month. This plan provides essential analytics features suitable for small businesses looking to track and analyze their marketing efforts.
Medium Business Plan: Geared towards businesses with up to 50,000 monthly visits.
Pricing starts from £584 per month. This plan offers more advanced analytics capabilities, ideal for mid-sized businesses seeking deeper insights into their marketing performance.
Large Business Plan: Tailored for businesses with up to 100,000 monthly visits. Pricing starts from £999 per month. The large business plan provides comprehensive analytics tools, suitable for enterprises needing robust tracking and reporting features to optimize their marketing strategies.
Advanced Plan: Customized pricing available for businesses with over 200,000 monthly visits.
This plan offers scalable solutions for high-traffic websites and large enterprises, with personalized features and support tailored to meet specific business needs.
Maximize Results with Index365: Your Digital Partner
Partner with Index365 today and harness the power of our comprehensive digital marketing solutions. With our proficiency in SEO, Website Design, Google Ads, and more, we utilize top-tier marketing tools to drive outstanding results.
Partner with us today and unlock the full potential of your business. Contact us to learn more about our services and take the first step towards success.
